Shelfwide Cruises
How is hypoxia mapped in the summer?
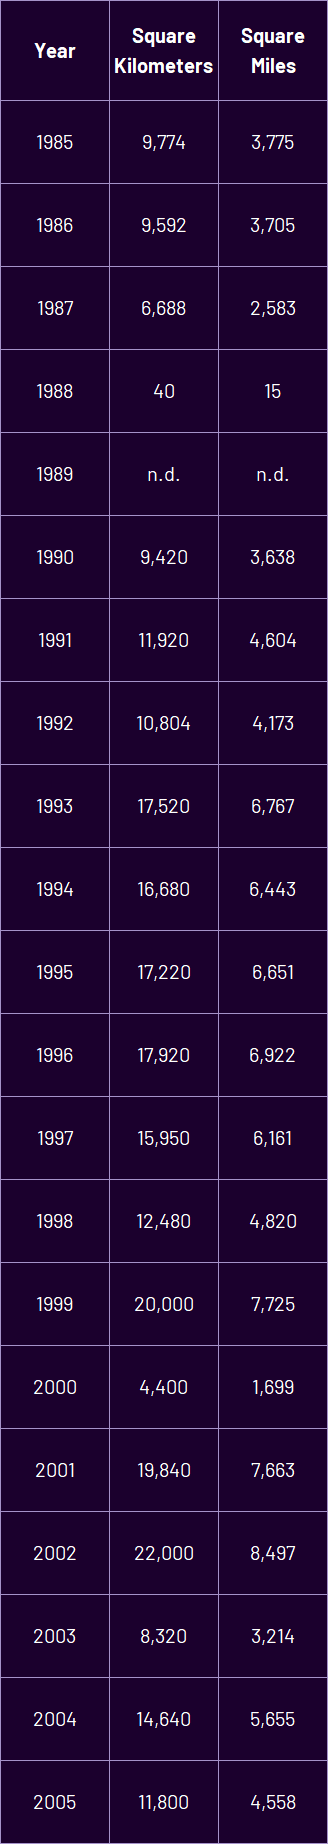
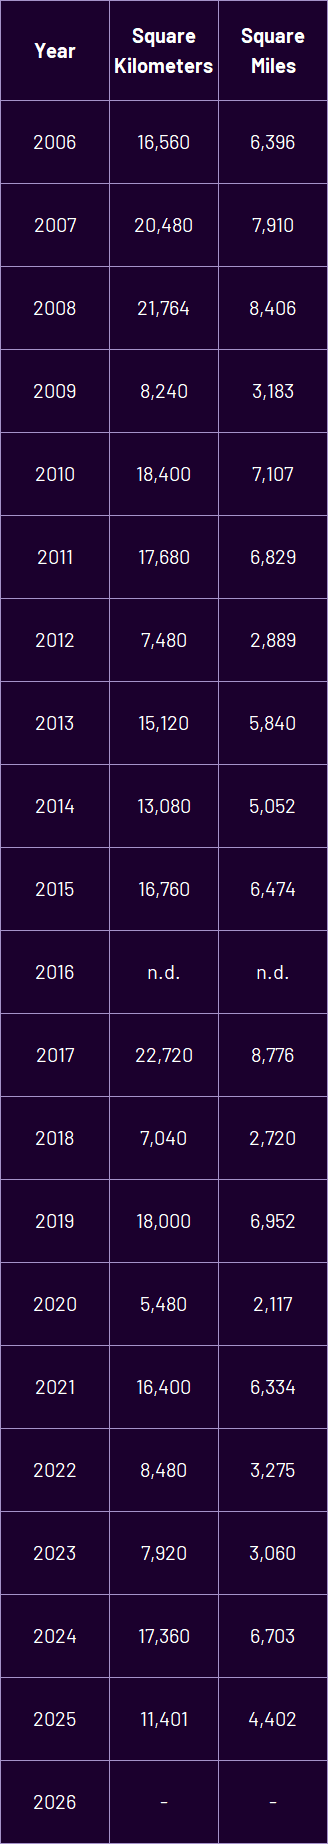
The area of bottom-water hypoxia has been mapped in summer from 1985 to present, except for 1989 and 2016. Hypoxic conditions were mapped that year, but only for half of the study area, due to lack of funds and ship time (n.d. = no data, in graphic). A grid of stations was laid out in 1985, transects (lines of stations) filled in during other years, and transects expanded to the west as the size of hypoxia increased. The main purpose of the summer cruise is to map the extent of hypoxia and the physical, chemical and biological parameters associated with it and to link the size with conditions in the Mississippi River watershed. The mapping begins at Southwest Pass of the Mississippi River (except in 2010) and progresses westward. An instrument, CTD with a rosette of Niskin bottles, is lowered through the water column.

The instruments at the bottom of the configuration electronically record depth, temperature, salinity, dissolved oxygen, turbidity, percent photo-synthetically available radiation and phytoplankton biomass. The Niskin bottles are used to collect water samples at discrete depths for measurement of water quality conditions. Each line of stations is transited so that the stations continue in an offshore or inshore (within the draft of the ship) direction until the area of hypoxia is exited. Some transects are extended past the offshore limits of hypoxia for comparison with prior years. Sometimes there is insufficient time to map the entire area. Thus, the estimated size is often less than actual size. There has been a consistent mapping protocol over a similar grid since 1985. Instrumentation is calibrated before, during and after the cruise to ensure quality data.
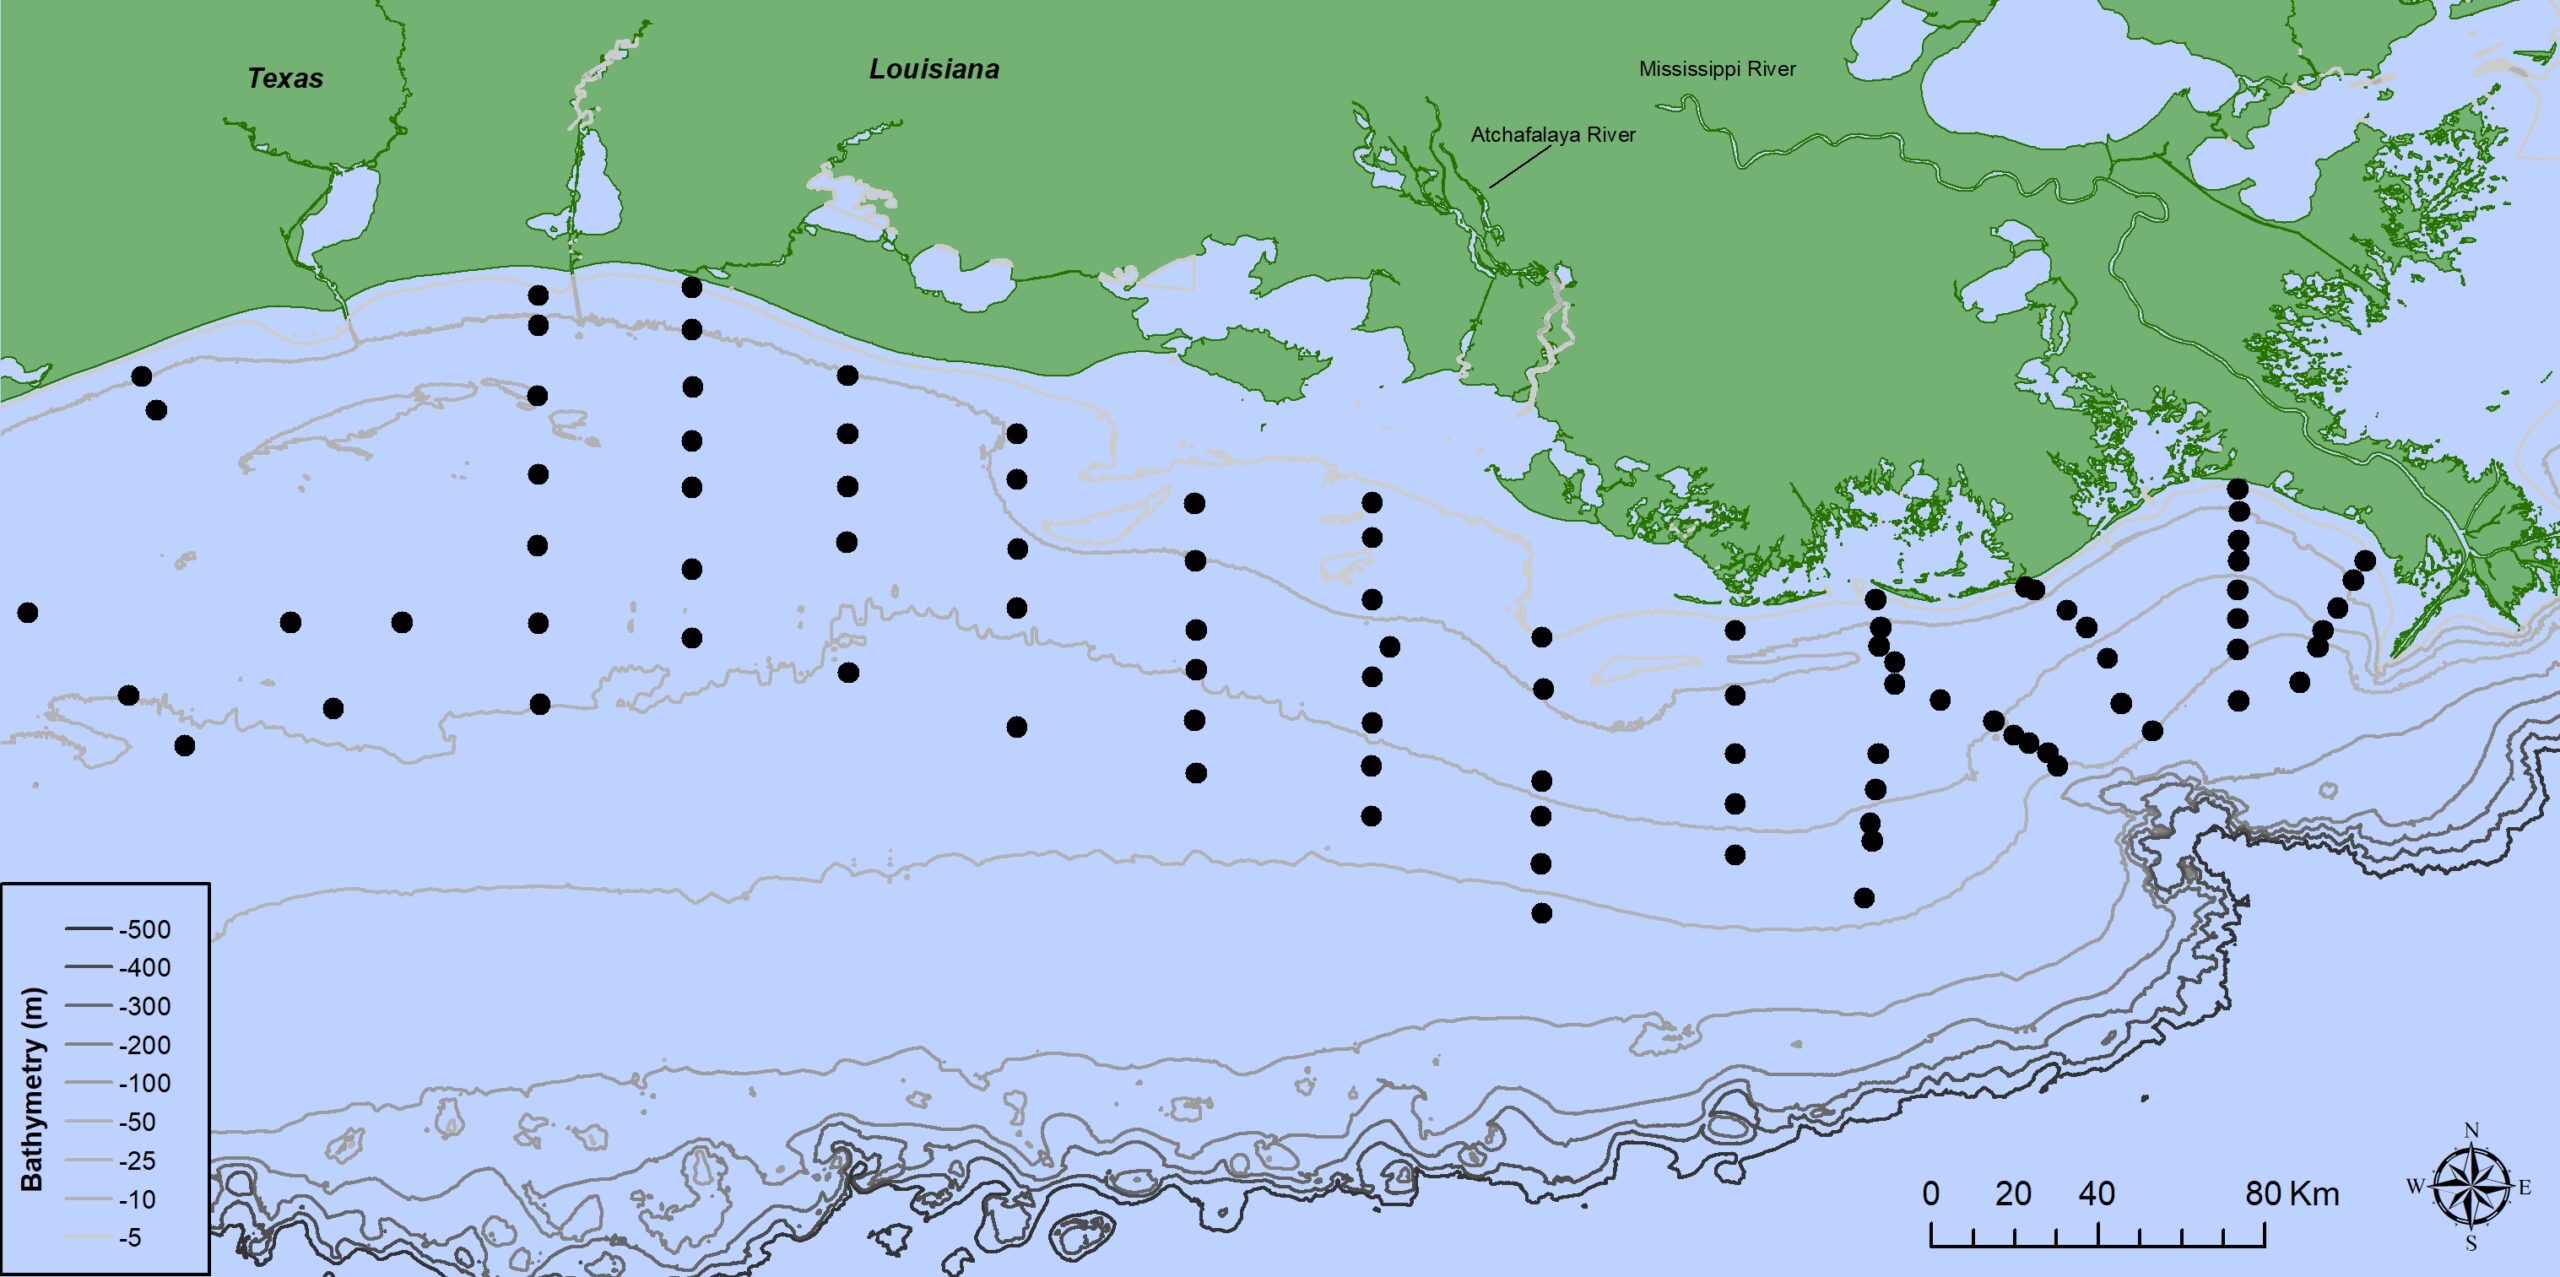
Cruise Station Map: Map of stations visited during the 2021 shelfwide cruise.
The size of the mid-summer bottom-water hypoxia extent is dependent on river discharge, nutrient loads in spring, weather conditions and oceanographic currents. The single best predictor for the mid-summer size is the nitrate load in May, plus a year term. This single variable explains 81% of the variability from year-to-year (Turner et al. 2006). The amount of fresh water being discharged and the load of phosphorus are also important, but not as important as the nitrate-nitrogen load. Thus what occurs in the Mississippi River watershed in spring and summer influences the distribution and dynamics of hypoxia. Weather conditions and currents in the summer further refine the distribution when the area is mapped, usually in late July.
The time of the year that the hypoxia is mapped is during mid to late July and as late as early August. Variability of the mid-summer extent is thus constrained, at least with regard to time of year. The size in late July is used as a benchmark to reach the federal-state agreed upon ecological goal of 5,000 km2 by the year 2015 over a 5-year running average (Mississippi River/Gulf of Mexico Nutrient Task Force 2001, 2008). The variability from year-to-year is evident in the graph of the yearly sizes and reason not to use a single year as the benchmark.
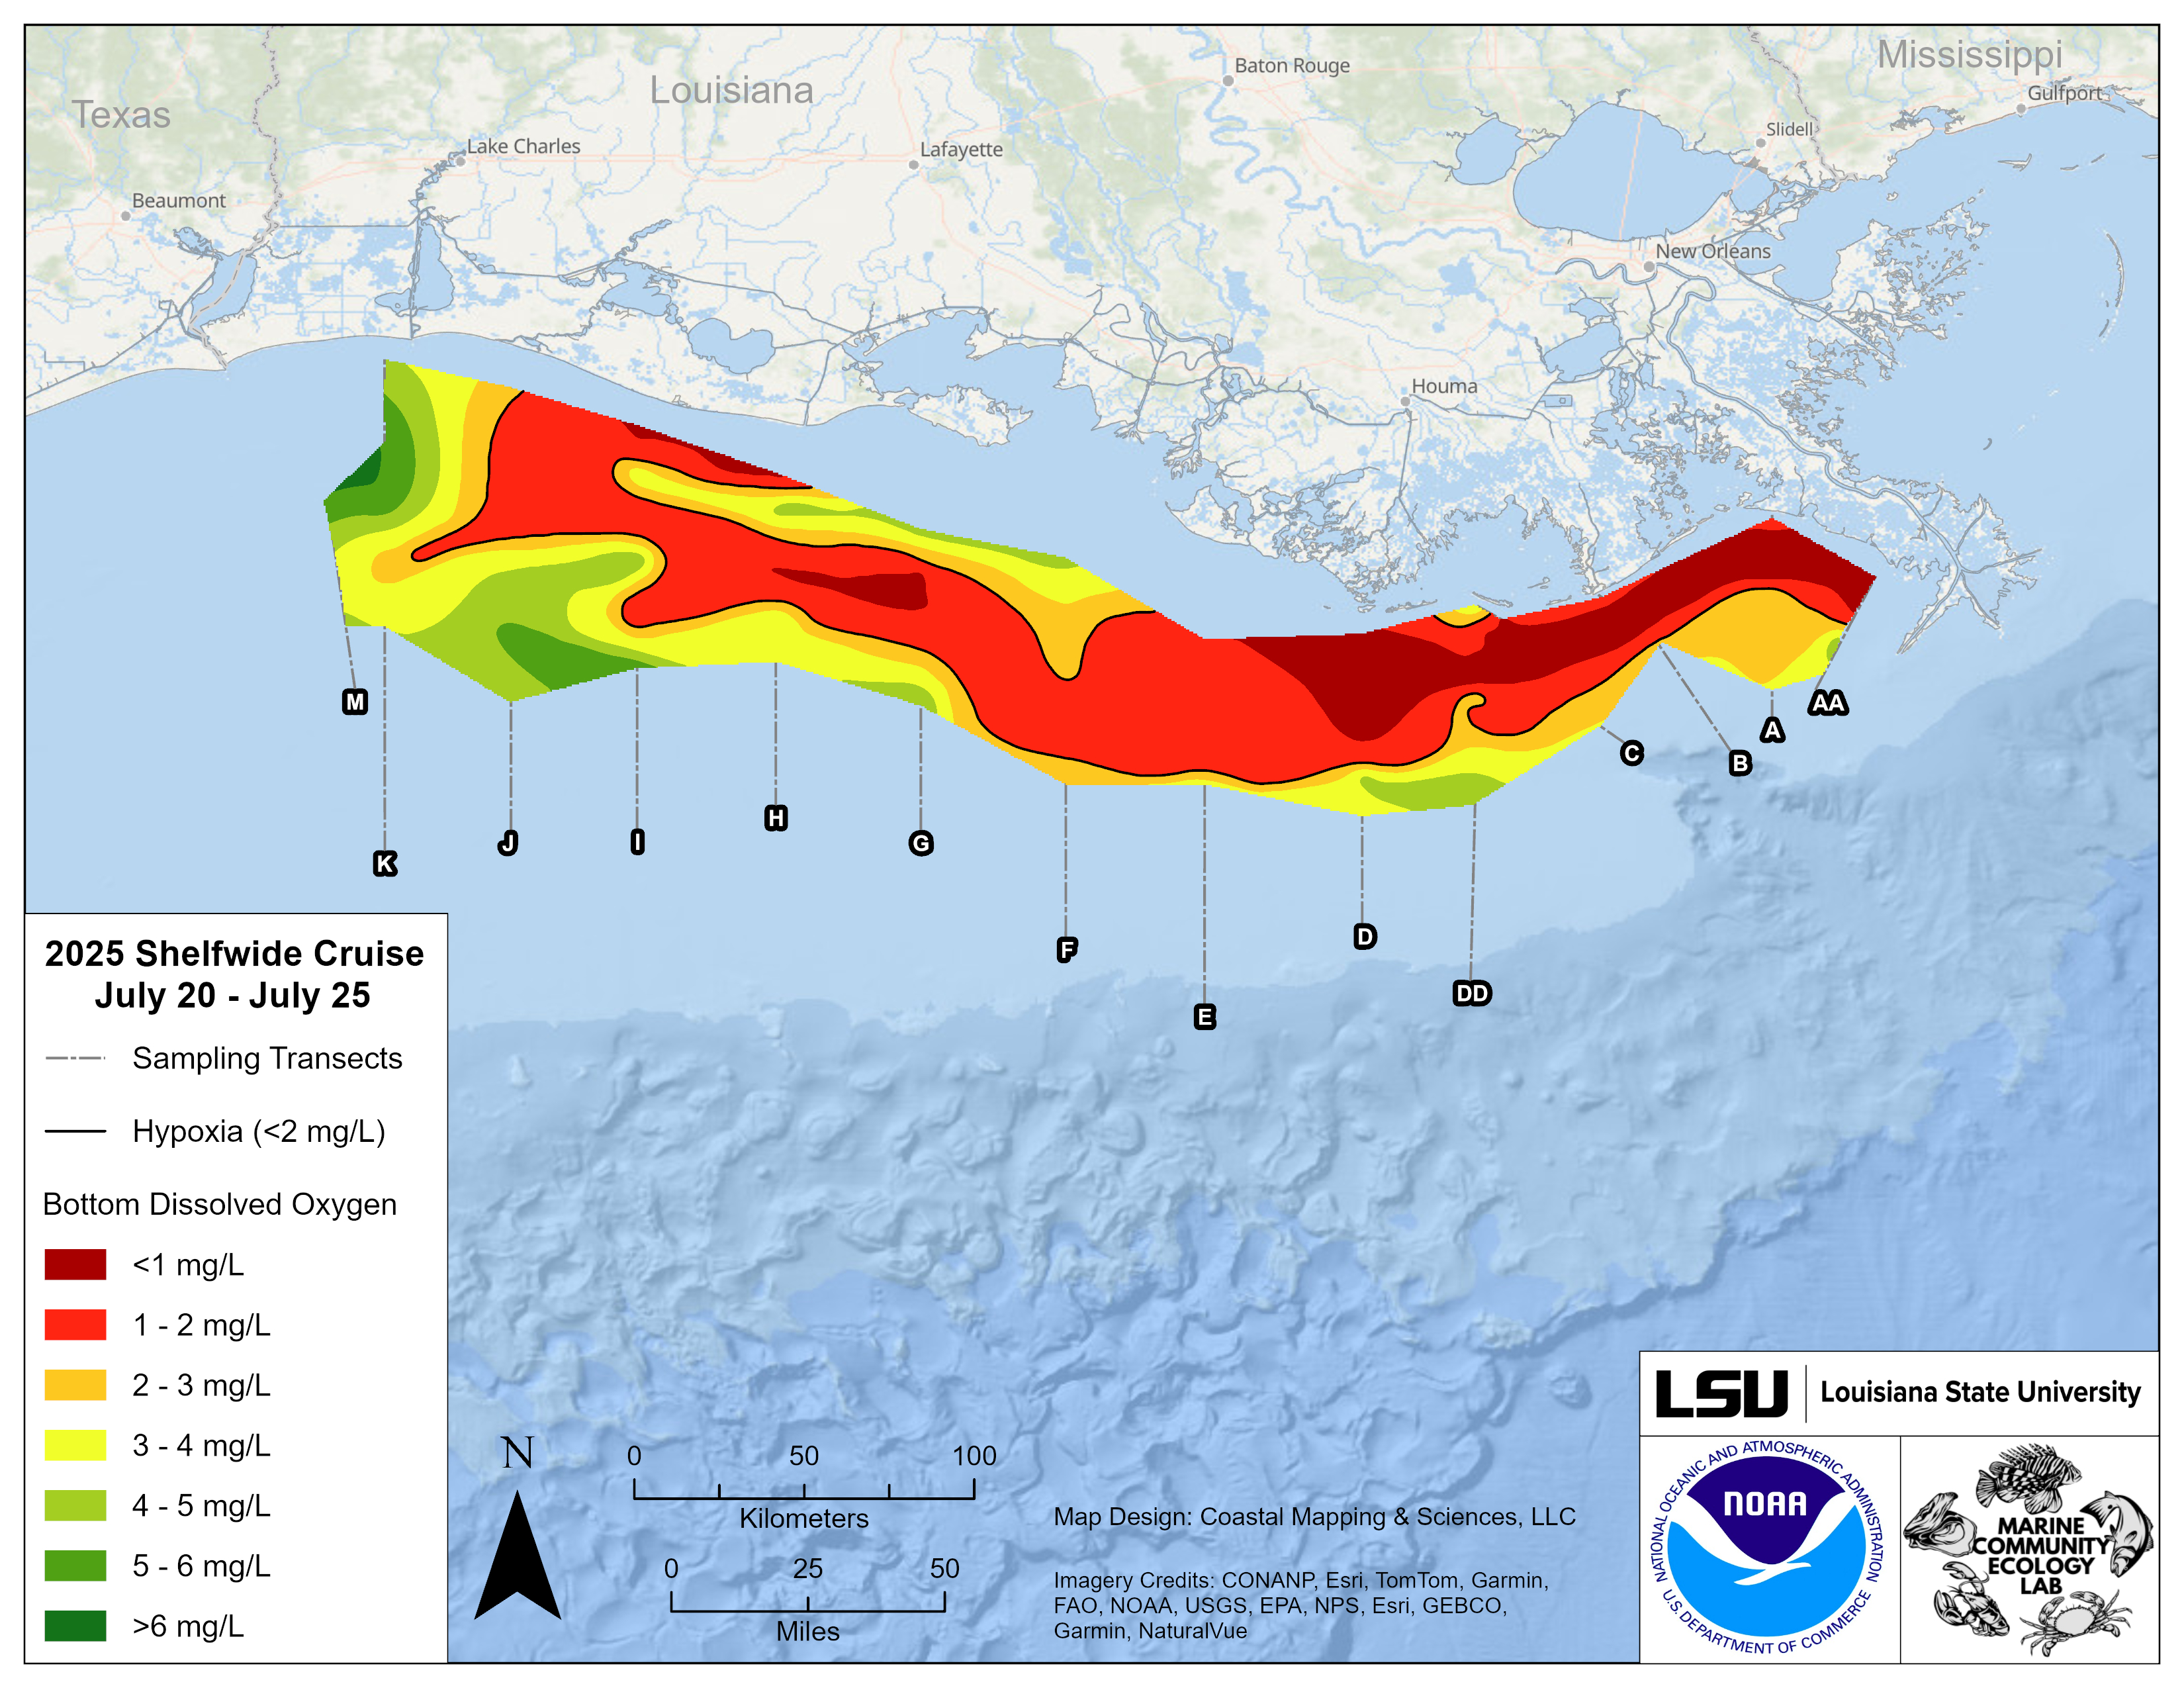
Map of ocean-floor dissolved oxygen: Results from the 2025 Shelfwide Cruise (Full Cruise Details)
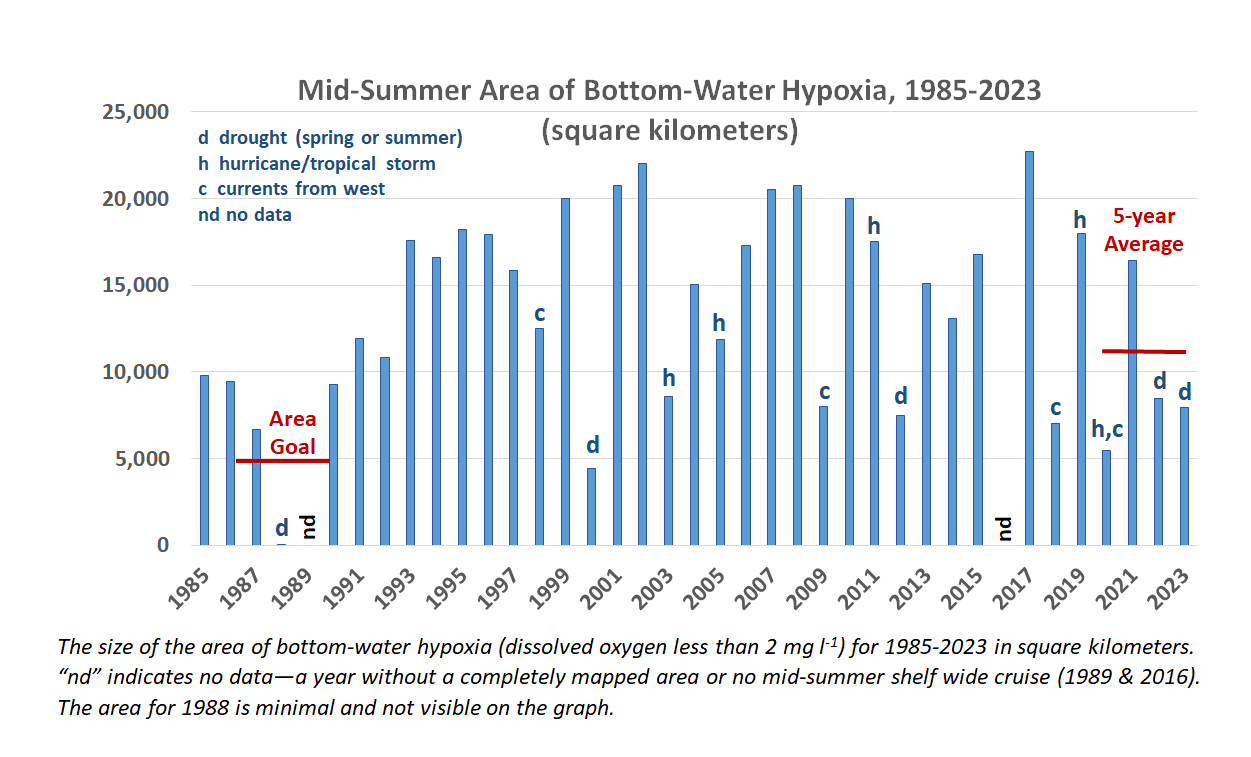
Area of bottom water hypoxia for mid-summer cruises, 1985-2023: Hypoxia Action Plan goal for reduced size is shown on the histogram along with the 5-year running average. In February 2015, the HTF announced that it would retain the original goal of reducing the areal extent of the Gulf of Mexico hypoxic zone to less than 5,000 km2 and extend the time of attainment from 2015 to 2035.
Data Source: Nancy N. Rabalais, LUMCON and R. Eugene Turner, LSU
Funding Source: National Oceanic and Atmospheric Administration, National Centers for Coastal Ocean Science

Causes of variation in summer size
The occurrence of a drought (d) in the diagram means less fresh water and fewer nutrients reaching the Gulf of Mexico. In 1988 (d), freshwater discharge and nutrient load were normal in spring, and hypoxia developed in May and June of that summer. The freshwater flow fell below the long-term average in July. The fresh water needed to maintain stratification (layering of the water column) was absent. Oxygen from the surface waters was then able to diffuse to the bottom and raise the oxygen concentrations. In 2000, there was a drought within the watershed in spring, fewer nutrients reached the Gulf, carbon fixation and flux were lower, and less hypoxia formed. There was sufficient fresh water in the summer to maintain stratification so that hypoxia occurred but over a smaller area.
Stratification (or layering of the water column) is a necessary condition for the maintenance of hypoxia once it has formed from decomposition of organic matter from the upper water column. A tropical storm or a hurricane in the summer will mix the water column and force oxygen to the bottom, especially in shallower waters. The mixed conditions and higher oxygen in the bottom waters persists for 4 to 7 days while the decomposition and depletion of oxygen overcomes the resupply of oxygen. Hurricanes (h) occurred just prior to the cruises that mapped the oxygen conditions in 2003, 2005, 2006, 2007, 2008, and 2010. Otherwise, the size of the bottom area of hypoxia would have been larger.
Oceanographic currents (c) in response to winds (long-term weather patterns) will also affect the distribution of summer hypoxia. During the summers of 1998 and 2009 several weeks prior to the mapping cruises, the winds were stronger than usual from the southwest. This resulted in water masses being pushed towards the east. Thus, hypoxia that may have been a feature of the upper Texas coast or the western Louisiana shore were piled up to the central and eastern coasts of Louisiana. Wind measurements and current measurements confirm this phenomenon. As a result, the “footprint” of bottom-water hypoxia was smaller, but the total volume was consistent with other years. i.e., the hypoxia was thicker on the central and eastern portions of the area mapped.
How does the size of hypoxia compare?
A size of 22,000 square kilometers or 8,500 square miles is often hard to comprehend without reference points. The size is often compared to the size of a state, such as the size of New Jersey or Massachusetts, or another water body. For those in Louisiana, a comparison with Lake Pontchartrain puts the hypoxic area more than 10 times larger.
Driving distance is also a key to how large the hypoxic zone is. As the R/V Pelican steams across the Gulf of Mexico from the Mississippi River delta to Galveston TX, it would be equivalent to the distance:
- Washington, DC to Boston, MA
- Mobile, AL to Jacksonville, FL
- Memphis, TN to New Orleans, LA

Comparisons of GOM hypoxia to the size of various states and water bodies
Long-Term Monitoring
Routine, continuing and consistent data collections since 1985 have provided the necessary long-term data with which we can:
- Document the temporal and spatial extent of hypoxia
- Identify the hydrographic, chemical, and biological data related to the development and maintenance of hypoxia
- Develop predictive models of relationships between riverine nutrient loading and the size of the hypoxic zone and its severity.
Understanding the physics is relevant to the study of biological processes, nutrient cycling, and dissolved oxygen dynamics. Likewise, physical measurements alone do not provide sufficient information to understand the development and maintenance of hypoxia. Documenting the extent of hypoxia over large areas and through time is essential in understanding its formation through an annual cycle. These observations provide a synthetic, interdisciplinary dataset that directly supports improved modeling, better understanding, and important strategies related to nutrient management scenarios within the Mississippi River basin and resource management in the Gulf of Mexico.